Introduction to the MOS Performance dashboard
| RingEX
Last updated on September 01, 2021
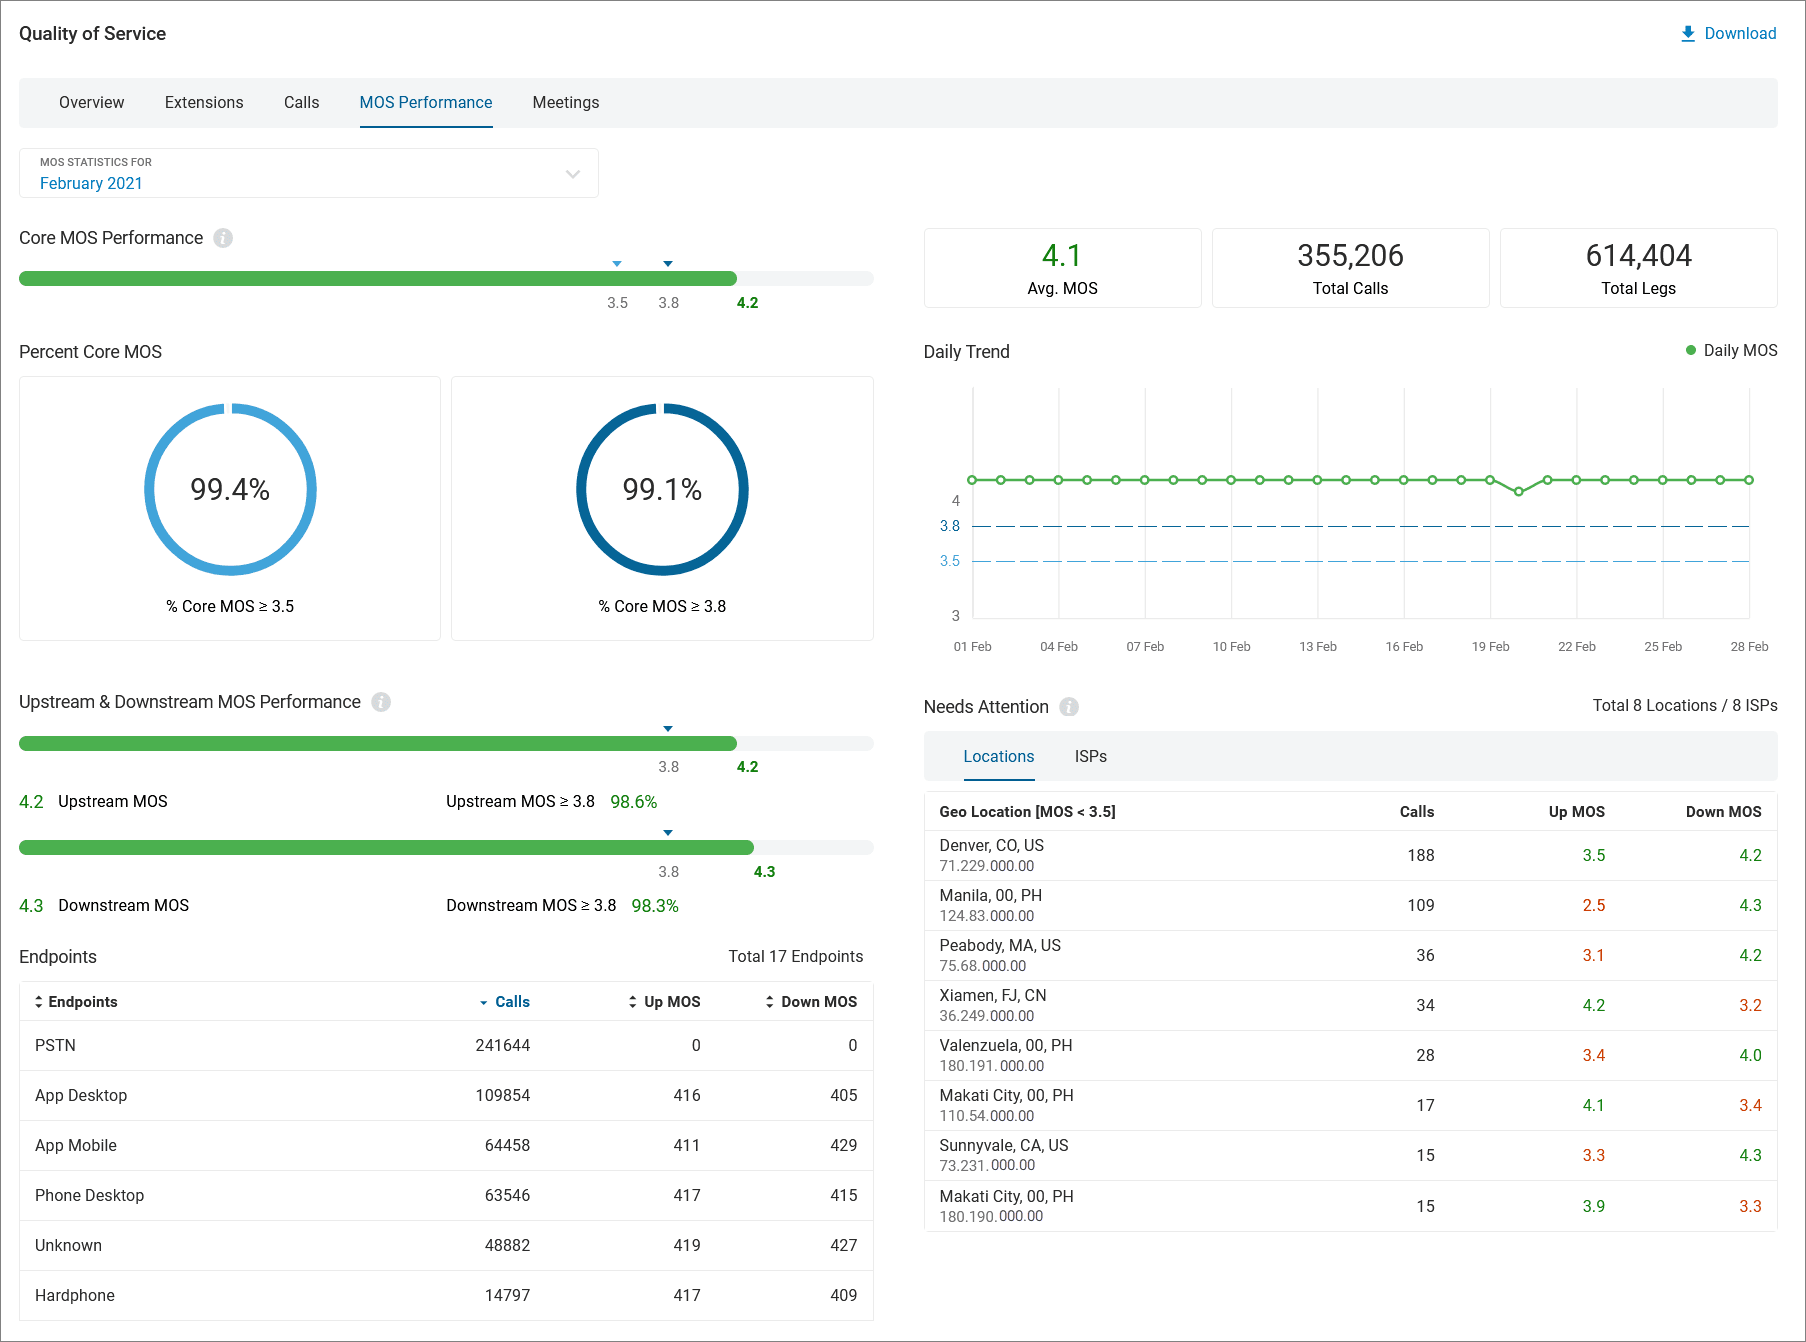
The Mean Opinion Score (MOS) Performance dashboard provides an overview of call quality levels based on minimum and target MOS thresholds on a per-month basis, as far as six prior months. Superior call quality is a minimum average monthly MOS score of 3.5 or higher for RingCentral core services.

MOS Performance dashboard components
The Quality of Service page is identified in the top left corner. Along the top navigation bar are the tabs available for Quality of Service reporting. On the far right is an option to Download the current dashboard image as a pdf file.

Filter
The MOS Statistics For filter is located beneath the top navigation bar. It allows you to customize your report to show data for any calendar month of the six prior months.

Widgets
Widgets on the MOS Performance page show data for the selected month as quality breakdowns for:
- Summary statistics: Average MOS, total calls, and total legs
- Core MOS Performance: RingCentral core MOS higher or equal to 3.5 (see the left donut) and 3.8, along with average MOS, total number of calls, and total number of legs
- Percent Core MOS: Percentage of calls with RingCentral core MOS higher than or equal to 3.5 in the left circle graph. The right circle graph shows core MOS higher than or equal to 3.8.
- Daily Trend: Daily trend of average scores for all call legs
- Upstream and Downstream MOS Performance: Difference between the upstream and downstream MOS performance across all call legs
- Needs Attention: Top eight locations and ISPs with an average upstream or downstream MOS of less than 3.5
- Endpoints: Breakdown of MOS performance by endpoints
Downloading the MOS Performance report
On the far right of the MOS Performance tab is a Download option.

Clicking Download lets you save an image of the current dashboard in graphic form as a PDF file.