Rooms & Devices: Current Rooms Snapshot widget on
the Overview dashboard | RingEX
Last updated on September 01, 2021
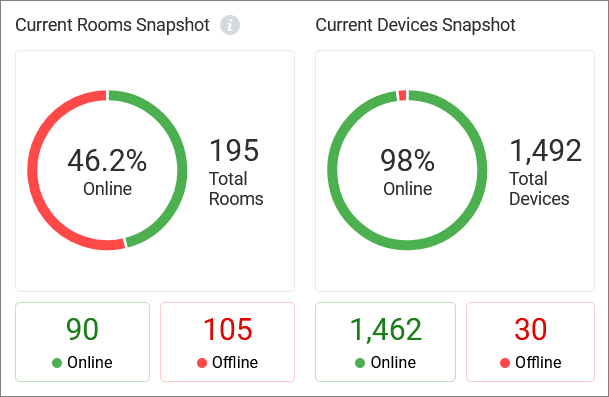
The Current Snapshot widget shows the status of rooms and devices, with percentage and numerical data for those that are online and those that are offline.

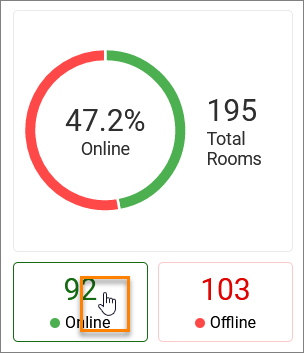
A circle graph represents the total number of rooms or devices that were Online at least once in the last seven days. It displays red and green colored segments, where green represents the percentage of rooms or devices that are online, and red depicts the percentage that are offline. The total number of all rooms or provisioned devices on the account are shown to the right of the circle. Below the circle, the quantity of online and offline rooms or devices that were online at least once in the last seven days are shown as numerical values. Clicking on the values in the boxes showing Online or Offline redirects to the Rooms or Devices dashboards.

The Rooms snapshot data displays on the left and the Devices snapshot displays on the right.
Status for Rooms:
- Online: A meeting can be held. The controller and host are online.
- Offline: A meeting cannot be held. The controller and/or host are offline.
Status for Devices:
- Online: Device is connected.
- Offline: Device is disconnected.