
Engage Voice | Insight types
Before you can craft insights, you have to consider what insight type you want to make. There are fifteen insight types available, and depending on what type of insight you are creating, you may not be able to use certain measures.
All insight types are represented by their respective icons in the insight type switcher in Analytical Designer. You can hover your mouse over each icon and a tooltip with the insight type’s name will appear.
In Components of Analytical Designer, we discussed how each insight type has different sections. These sections are Measures, Rows, Columns, View By, Stack By, Trend By, and Segment By. Each section will have a different purpose for the specific insight type you choose.
As discussed in Creating an insight, some measure and attribute combinations won’t work in certain insight types.
Below are the different insight types you may choose from:
- Table: This insight type is similar to pivot tables in spreadsheet programs. It creates a table to display data
- Column chart: This insight type compares values by using vertical bars
- Bar chart: This insight type compares values by using horizontal bars
- Line chart: This insight type display changes in measures across time or progress across a series of stages, represented by a line
- Stacked Area chart: This insight type is similar to a line chart in that it displays changes in measures across time or progress across a series of stages. However, instead of just a line, the space between the line and the X-axis is filled with color. It is also stacked, meaning it has multiple area charts displayed over each other
- Combo chart: This insight type combines two types of charts — column and area or line — into a single insight
- Headline: This insight type displays a single number or compares two numbers in a bold, ‘headline’ type of visualization
- Scatter plot: This insight type displays data as points using Cartesian coordinates
- Bubble chart: This insight is similar to a scatter plot in that it displays data as points using Cartesian coordinates. However, instead of just points, it uses bubbles. Bubble sizes also change depending on the data of a measure
- Pie chart: This insight shows data as segments of a disc or a pie
- Donut chart: This insight shows data as segments of a disc with a hollowed center, similar to a donut
- Treemap: This insight displays data hierarchically as nested rectangles
- Heatmap: This insight displays data as a matrix where individual values are represented as colors
- Bullet chart: This insight displays performance of selected measures and progress towards a goal specified by another measure
- Geo chart: This insight displays a map of a region, and data points are shown as bubbles using coordinates from the location attribute

Table
Tables in Analytical Designer are more commonly known as pivot tables in other programs. These can have up to 20 attribute rows and columns for your insight. After inserting the appropriate data, they are then merged according to the attribute order in the rows or columns sections.
Tables have the following sections: Measures, Rows, Columns, and Configuration. While configuration appears as a section, it will be empty as tables do not support configuration.
Pivot tables can also:
- Display the values as a percentage
- Compare your data to the previous period or same period of the previous year
- Group data when sorted by the first item in the Rows section

Column chart
By default, when you add measures or attributes to a report, they are displayed in a column chart.
Column charts have the following sections: Measures, View By, Stack By, and Configuration.
In column charts, you can:
- Display the values as a percentage
- Stack the chart by attributes
- Compare your data to the previous period or the same period of the previous year
- Display a secondary Y-axis on the right side. You must check the show on right axis checkbox in a measure settings
You must add the date data or attributes to the View By section. To add attributes to the Stack By section, you must only have a single item in the Measures section. If you have multiple measures in the Measures section, you can stack the measures.

Bar chart
Bar charts show your data in horizontal bars and have the following sections: Measures, View By, Stack By, and Configuration.
In bar charts, you can also:
- Display the values as a percentage
- Stack the chart by attributes
- Compare your data to the previous period or the same period of the previous year
- Display a secondary X-axis at the top. You must check the show on top axis checkbox in a measure settings
You must add the date data or attributes to the View By section. To add attributes to the Stack By section, you must only have a single item in the Measures section. If you have multiple measures in the Measures section, you can stack the measures.

Line chart
Line charts can display changes in measures across time or progress across a series of stages.
Line charts have the following sections: Measures, Trend By, Segment By, and Configuration.
If you configure the Trend By section and add a date data or an attribute, you display a trend line. Trend lines connect individual measure or attribute values. Adding another attribute to the Segment By section will transform your simple line graph into a line segment graph.
In line charts, you can:
- Display the values as a percentage
- Display individual values of an attribute
- Add an attribute to the Segment By section and only include a single item in the Measures section
- Compare your data to the previous period or the same period of the previous year
- Display a secondary Y-axis on the right side
You must check the show on right axis checkbox in the measure settings. You must also add the date data or an attribute to the Trend By section.

Stacked area chart
Stacked area chart shows data as an area under a line that connects data points. They are similar to line charts and express changes across time.
Stacked area charts have the following sections: Measures, View By, Stack By, and Configuration.
In stacked area charts, you can:
- Display the values as a percentage
- Stack the chart by attributes
You must add a date data or an attribute to the View By section. To add attributes to the Stack By section, you must only have a single item in the Measures section.

Combo chart
Combo charts combine two types of charts — column chart and area or line chart — into a single insight. You can compare your sales numbers to your target or two measures with different value ranges.
Combo charts have the following sections: two Measures (as columns, lines, or area), View By, and Configuration.
Combo charts can:
- Display the values as a percentage
- Compare your data to the previous period or the same period of the previous year
- Display a secondary Y-axis on the right side
You must add the date data or an attribute to the View By section. You must check the show on right axis checkbox that appears when you click the menu icon in the second Measures section.

Headline
Headlines can display a single number or compare two numbers. You can display both measures and attributes.
Headlines have two sections: Measure (primary) and Measure (secondary).
You can add one item to each section. If you add two items, the insight displays the change in percentage between the primary and the secondary measure. Headline insight type does not have configurations.
To compare your data to the same period of the previous year, add a date data to the filter section and adjust the settings accordingly.

Scatter plot
Scatter plots show data as points using Cartesian coordinates. Scatter plots can have two measures, one for the X-axis and the other for the Y-axis, and one attribute, which determines the meaning of each data point. You can use scatter plots to analyze trends between two measures or to track the magnitude of two measures from the same chart.
Scatter plots have the following sections: Measure (X-axis), Measure (Y-axis), Attribute, and Configuration.

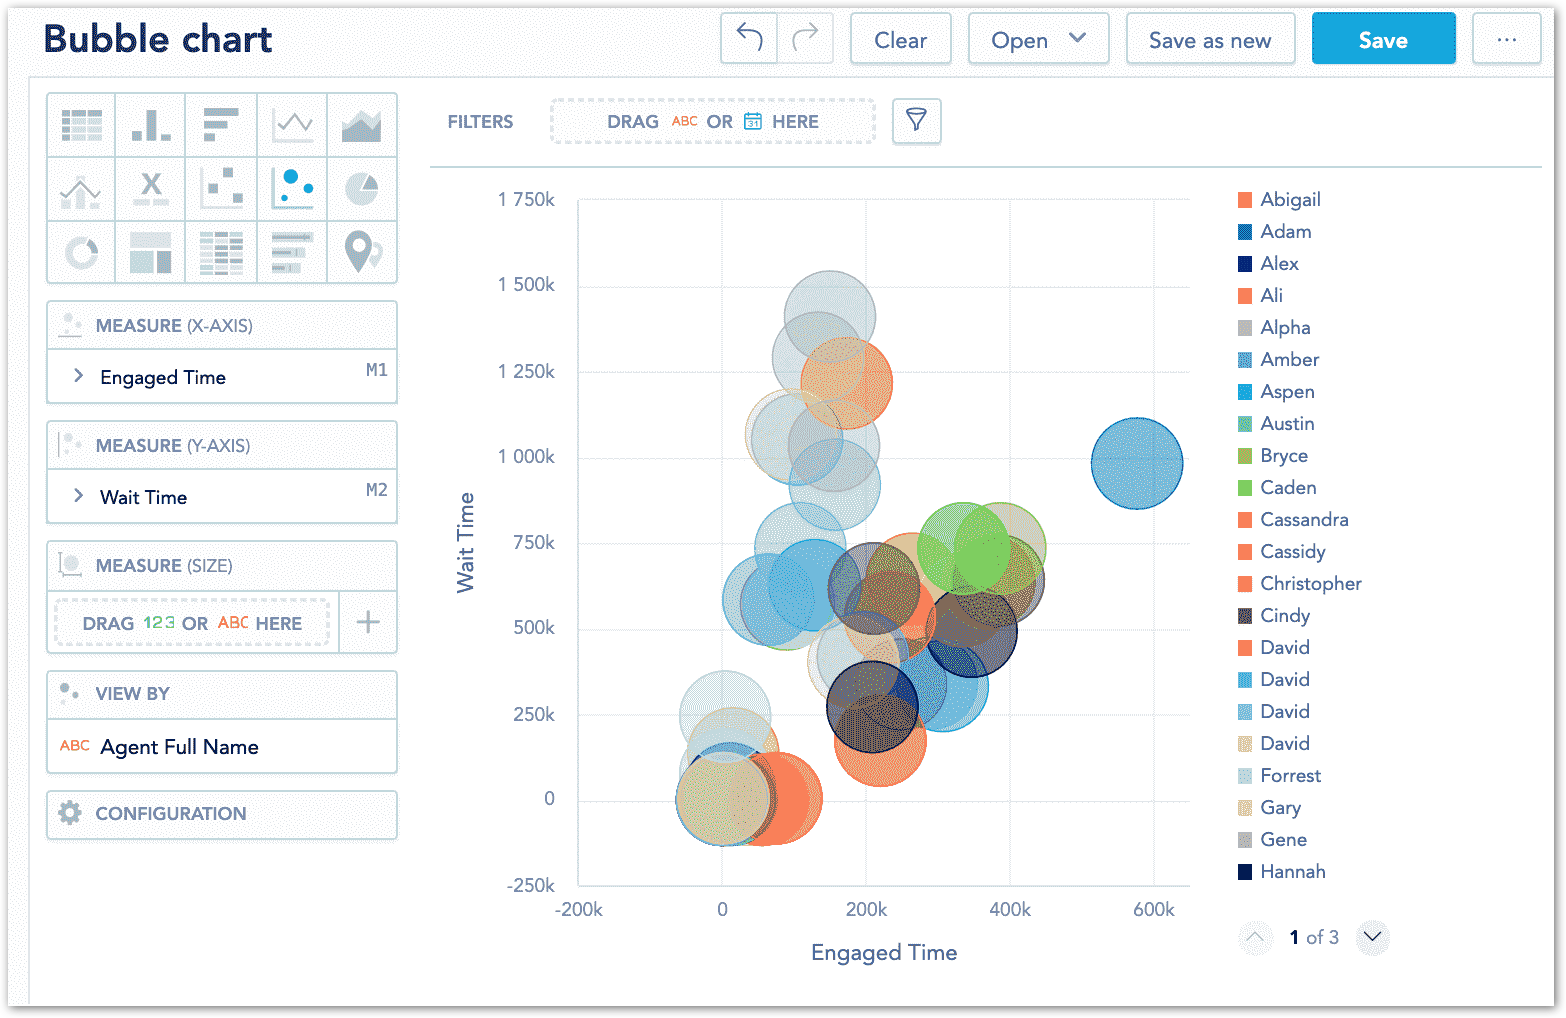
Bubble chart
Bubble charts are similar to Scatter plots. They show data points as bubbles using Cartesian coordinates. In addition, bubble charts can display the size of the bubbles in proportions using a third measure. If you add an attribute to the View By section, the bubbles get different colours for each attribute value.
Bubble charts have the following sections: Measure (X-axis), Measure (Y-axis), Measure (Size), View By, and Configuration.
Pie chart
Pie charts show data as proportional segments of a disc. Pie charts can be segmented by either multiple measures or an attribute, and allow users to visualize component parts of a whole.
Pie charts have the following sections: Measures, View By, and Configuration.
In pie charts, you can also:
- Display the values as a percentage
You must add the date data or an attribute to the View By section.

Donut chart
Donut charts show data as proportional segments of a disc with a hollowed out center. Donut charts can be segmented by either multiple measures or an attribute, and allow viewers to visualize component parts of a whole.
In donut charts, you can display the values as a percentage. You must add a date data or an attribute to the View By section.

Treemap
Treemaps display your data hierarchically as nested rectangles. Treemaps are useful for comparing proportions within the hierarchy.
Treemaps have the following sections: Measures, View by, Segment by, and Configuration.
In treemaps, you can also:
- Display the values as a percentage
- Segment the treemap by attributes (The treemap shows the attributes as different shades of a color)
You must add the date data or an attribute to the View By section. To add attributes to the Segment By section, you must have only a single item in the Measures section.

Heatmap
Heatmaps display data as a matrix where individual values are represented as colors. You can use heatmaps to discover trends and understand complex datasets.
Heatmaps have the following sections: Measure, Rows, Columns, and Configuration.
The legend above the heatmap shows the values of individual colors. The higher the value, the darker the color.

Bullet chart
Bullet charts display performance of selected measures and progress towards a goal specified by another measure.
Bullet charts have the following sections: Measure (Primary), Measure (Target), Measure (Comparative), View By, and Configuration.
In bullet charts, you can compare your data to a previous period or the same period of the previous year.

Geo chart
Geo charts or pushpins show you data that are broken down geographically. They show data points as bubbles using the coordinates from the location attribute. In addition, geo charts can display the size of the bubbles in proportions using another measure. If you add an attribute to the Segment by section, the bubbles get different colors for each value.
Geo charts (pushpins) have the following sections: Location, Measure (Size), Measure (Color), Segment By, and Configuration.
Insight type configuration
In Components of Analytical Designer, we briefly talked about the configuration section in the analytical designer. Inside the configuration section are different properties that allow you to customize the look of your insight type. These properties are Axes (X- and Y-axis), Legend, Canvas, and Colors.
Depending on the insight type you’ve chosen, some properties may not appear. For example, Axes will not appear when you choose a pie graph, and Color properties will be absent in a table.
These configuration properties are:
- Axes: Allows you to reposition, hide, and set values for items on your axes (X-axis and Y-axis)
- Legend: Allows you to reposition the chart legend
- Canvas: Provides some cosmetic options for the chart canvas items like data labels and gridline
- Colors: Changes the color of your insight. If you choose a bar graph, you can customize bar colors. For line graphs, you can customize line colors, and so on for other insight types
© 1999-2022 RingCentral, Inc. Tous droits réservés.