Are you using the latest version of RingCentral?
Update your app now to enjoy the latest user experience, enhanced security, and optimal call quality.
Release Notes > Engage Voice > April 2022
Release Notes
RingCentral Engage Voice | April 2022
Stay up to date with the latest features, improvements, and bug fixes for RingCentral Engage Voice.
VERSION 22.2.1
Release Date: April 19, 2022
What's New
This is the 22.2.1 April Release Notes. We may provide updates on features and enhancements for Engage Voice products as we get closer to the rollout date.
RingCentral may update these Release Notes to document additional resolved and known issues.
This is the 22.2.1 Release Notes.
The following features are being released as part of the 22.2.1 Release.
- Engage Analytics - Added new and improved existing Metrics, Reports, and Dashboards.
- Engineering Improvements: The 22.2.1 April Release includes various improvements, including bug fixes and performance of Engage Voice software.
Engage Analytics - Added new and improved existing Metrics, Reports, and Dashboards
We have added new metrics, reports, and dashboards in addition to making enhancements to existing metrics, reports, and dashboards. These will benefit the overall user experience and provide new ways to analyze your contact center’s data for agent activities, conduct, and performance.
Metrics
Added new metrics
- Voice Mail Rate: Percentage of calls that connected to answering machines out of all interactions.
- Max Hold Time: Maximum time a customer was put on hold by the agent on the call.
Improved existing metrics
The following were improved so the data shown in the Inbound Overview dashboard is more accurate.
- Avg Queue Time
- Agent Assigned Count
Some metrics have similar functions. To improve user experience, some metrics will be deprecated.
- Avg Queue Abandon Time (legacy)
- Manual No Connect Dials Count (legacy)
Reports
Added new reports
- Interactions Distributions for Agents in Queue: Shows the correlation between wait time and the number of interactions for every agent, which can help analyze and better understand calls distribution within agents in queue.

- SLA Trend: Line chart that shows the percentage of calls or interactions that passed the SLA out of the total interactions queued. Used in Inbound Overview dashboard.

- Handle Time & Successful Calls: Bubble chart that shows the correlation between Avg Handle Time and Successful Calls.

- Handle Time & Escalation Rate: Bubble chart that shows the correlation between Avg Handle Time and Escalation Rate.

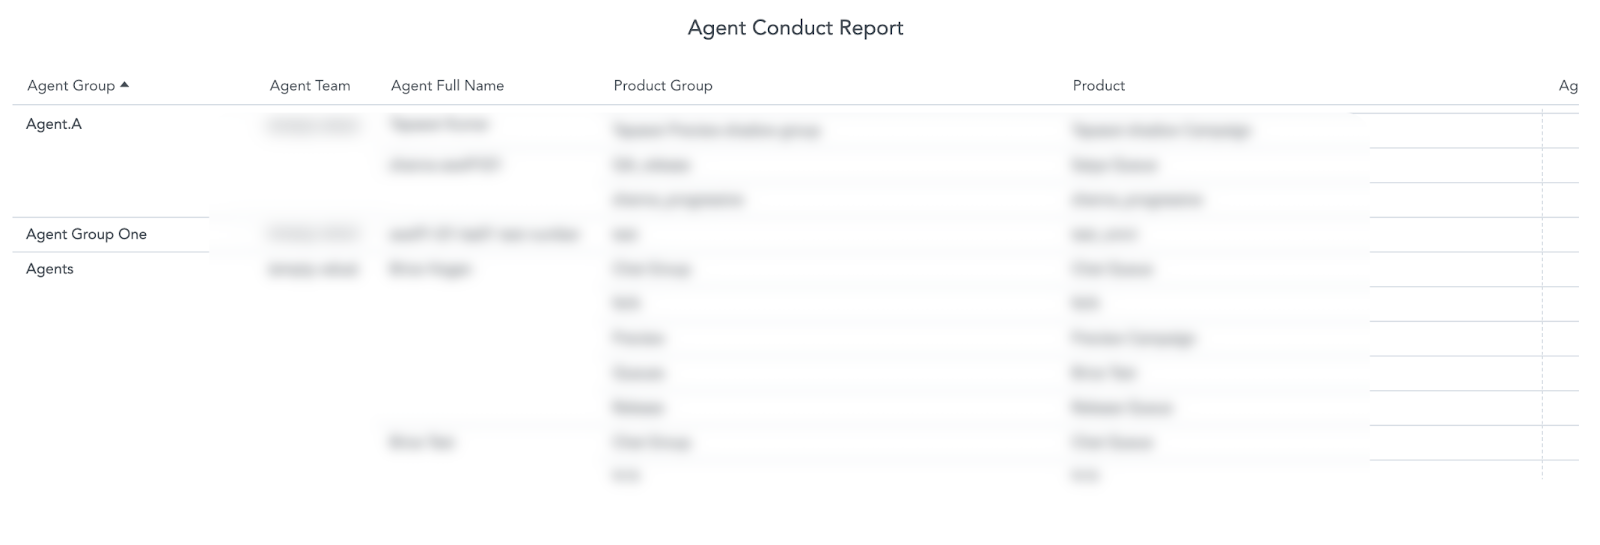
- Agent Conduct Report: Table chart that shows agent statistics to analyze and monitor any misbehavior of agent operations in handling interactions.

- Agent Handle Time in Group: Shows the individual average handle time for each agent, and the average handle time per agent group.

- Calls, Ring Time, Queue Time and RNA Time: Combo chart that shows the sum of the ring, RNA, and queue times in separate columns (left axis), with a line chart plotting the total number of calls (right axis) over a period of time.

- RNA by Agent: Bar chart that tracks the RNA count for each agent with drill down to a list of RNA related calls (Ring No Answer Call Details report).

- Top 10 Agent Handle Time vs All Agents: Combo chart that tracks the average handle time (bar, left axis) and the overall average handle time (line, right axis) for the top 10 agents. This helps identify agents with the most longer Handle Time durations in comparison to all agents.

- Ring No Answer Call Details: In-depth table that shows other metrics and how they connect to RNA calls. Other metrics include the date, time, call type, ANI, DNIS, product, etc.

- Voice Agent Utilization & Occupancy Trend: Compares Voice Agent Utilization vs Voice Agent Occupancy over time.

- Average Agent Wrap Up Time by Campaign: Heatmap of the average wrap-up time of agents in campaigns.

- Outbound Call Results: Bar graph that shows the number of call attempts per call result.

- Outbound Agent Dispositions: Bar graph that shows the number of call attempts per agent dispositions.

- Outbound Agent Activity: Table that shows different metrics related to outbound agent activities.

Improved existing reports
- Agents Monthly Trend report: Line chart that shows the number of agents logged in by month
- Previously, future months were shown with values of 0. Now we only show up to the current month.

Dashboards
Added new dashboard
- Agent Conduct: Provides the overall call center health and demonstrates any misbehavior of agent operations in handling interactions.

Improved existing dashboards
- Agent Activity
- Added a description for KPIs in the Agent KPIs section.
- Added Agent Utilization & Occupancy Trend report.
- Billing Period Overview and Billing Period Account Usage dashboards
- Added new filters.
- Inbound Overview
- New SLA Trend report added to Inbound Overview dashboard, renamed in the dashboard as SLA.
- Improvements for Avg Queue Abandon Time, Avg Queue Time, and Avg Speed of Answer columns in Inbound Overview Report under the Inbound Queue Details section.
- Added labels to the drill-down of Inbound Interactions chart.
- Added new KPIs.
- Renamed Inbound Interactions report to Queue Segments.
- Renamed Inbound Interactions Time report to Queue Segments Time.
- Outbound Performance
- Added Average Agent Wrap Up Time by Campaign report.
- Improved Outbound Performance Report.
- Improved Outbound Overview report.
- Improved Outbound Completed and Success Rate by Dial Group report.
- Added Outbound Call Results report.
- Added Outbound Agent Dispositions report.
- Added Outbound Agent Activity report.
Archive