Intro to the Alerts Log dashboard | RingEX
Last updated on September 01, 2021
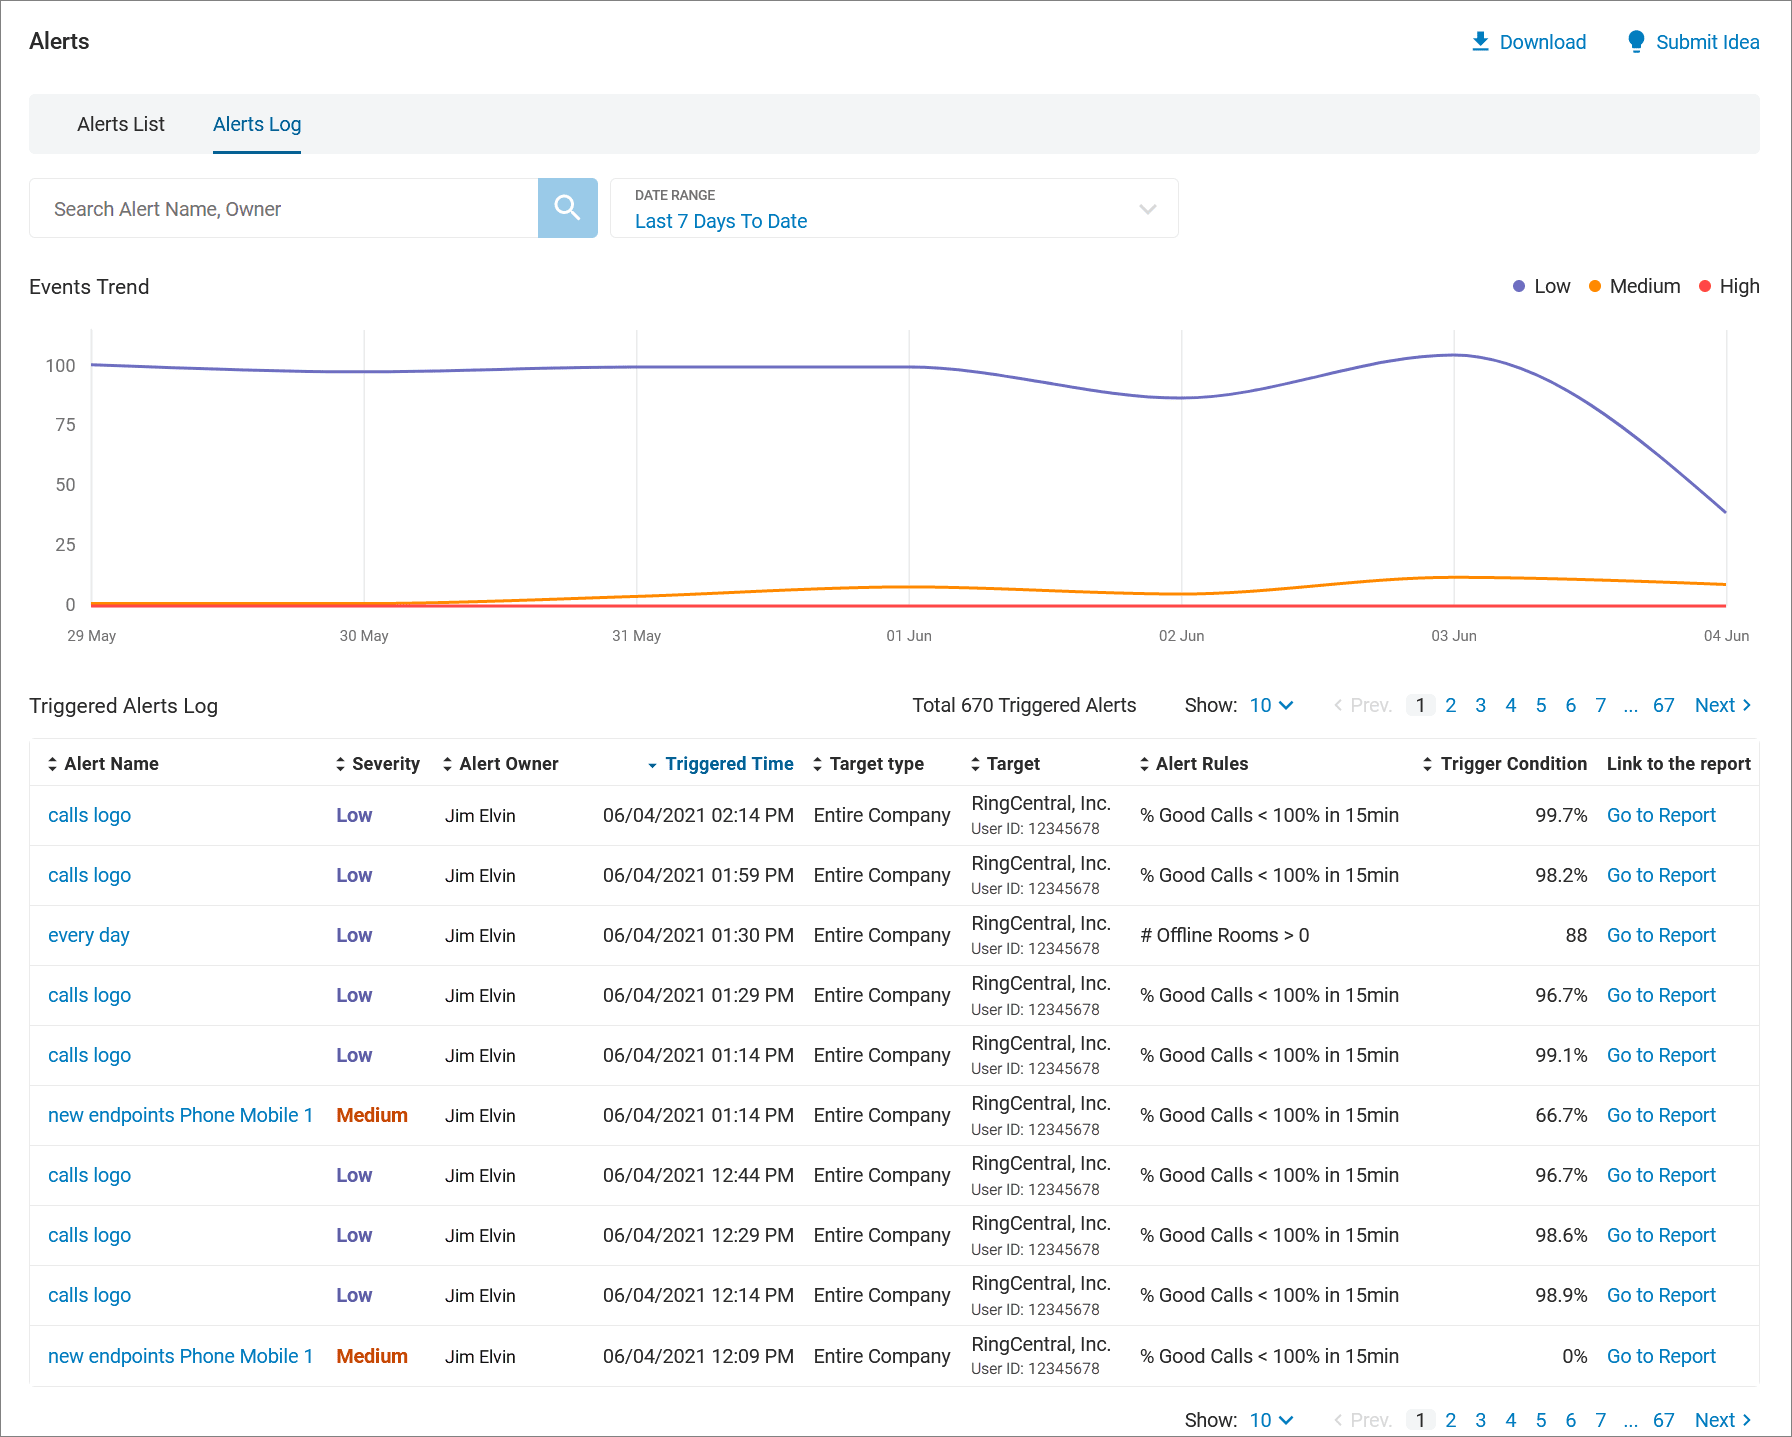
The Alerts log dashboard is the second tab in the Alerts page. It tracks alert notifications in your account over the last six months.

Alerts Log dashboard components
The Alerts page is identified in the top left corner. In the top navigation bar are the tabs available under Alerts. Choose the Alerts List tab when you want to exit Alerts Log and review data offered in the other tab.

Filters
The filters section is located beneath the top navigation bar. It allows you to customize your report to only include specific data. Use the filter fields to select for:
- Search Alert Name, Owner: Enter the name or partial name of an alert or its owner.
- Date Range: Select either a preset range or choose a range going back as far as six months.
Events Trend graph
The Events Trend graph displays triggered alerts that resulted in notifications. Three colored lines represent alerts at low, medium, and high alert severity.

Triggered Alerts Log
A table populated with alerts that have been triggered.

This widget shows data in table form, with details for each alert.
- Alert Name: The name given to the alert when it was set up.
- Severity: Low, medium, or high relative impact of an issue.
- Alert Owner: Who receives the alert.
- Triggered Time: Date and time when the event was triggered.
- Target type: Type of alert, set for Entire Company, Locations, Users, ISPs, Devices, or Rooms.
- Target: Name of object of target type, such as company name or ISP name.
- Alert Rules: Synopsis of rules that trigger the alert.
- Trigger Conditions: What threshold percentage triggers the alert.
- Link to the report: A clickable link that opens the full alert report in a new browser window.
Download
In the upper right corner is an option to download dashboard details as a spreadsheet. Click the download arrow and you will be prompted to save as an Excel file.
Submit Idea
Click the Submit Idea lightbulb icon to submit an idea or provide feedback to the Alerts team.

© 1999-2022 RingCentral, Inc. Todos os direitos reservados.