Using and understanding the Meetings report
| RingEX
Last updated on September 01, 2021
The Meetings tab is available for RingCentral Video only. This report populates as a table showing details for every RingCentral Video meeting within your organization, based on the filters you selected. Note that if you are viewing it on a mobile device, the elements discussed are stacked vertically on the screen.
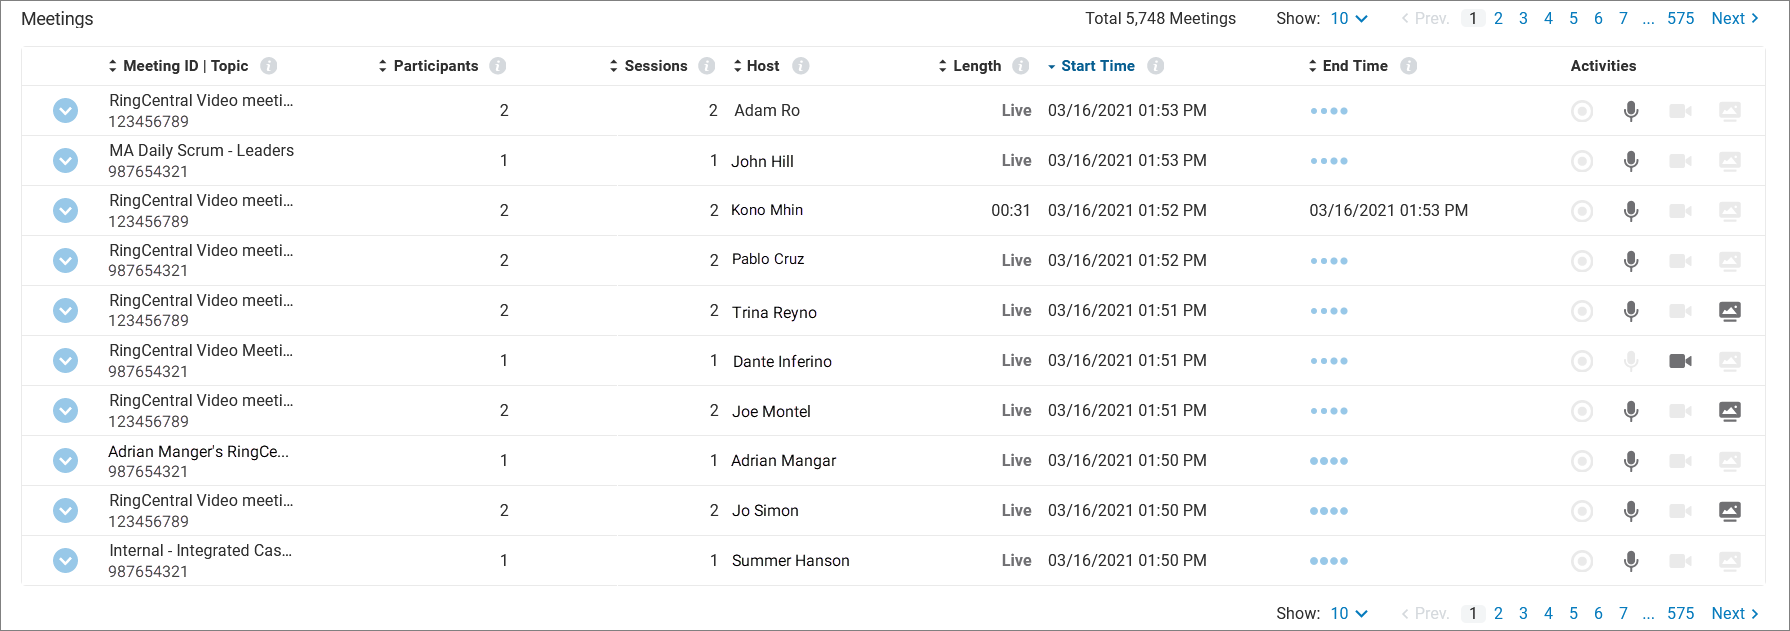
The top right shows the total number of meetings within your organization. Clicking the down arrow next to Show lets you choose how many entries to display on one page, with navigation to additional pages.
The following columns can be sorted using the arrows to the left of the column label:
- Meeting ID: Shows meeting topic name and meeting number that was used to join.
- Participants: Total number of participants.
- Sessions: Total number of distinct dial-ins.
- Host: Name of the user who hosted.
- Length: Duration between first user joining and last user to leave.
- Start Time: Time when the first participant joined.
- End Time: Time when the last participant left.
- Activities: Actions taken by participants to interact with meeting functionality:
Whether recording was enabled.
Whether at least one participant enabled audio.
Whether at least one participant enabled video.
Whether any participants shared their screen.
Call Card
Clicking anywhere in an entry row expands it to show a call card with complete meeting details, including:
- Participant names, connection time, endpoints used, features enabled
- Packet loss, jitter, and other quality indicators
- Details of networks used
All details shown in the call card can be copied to the clipboard.
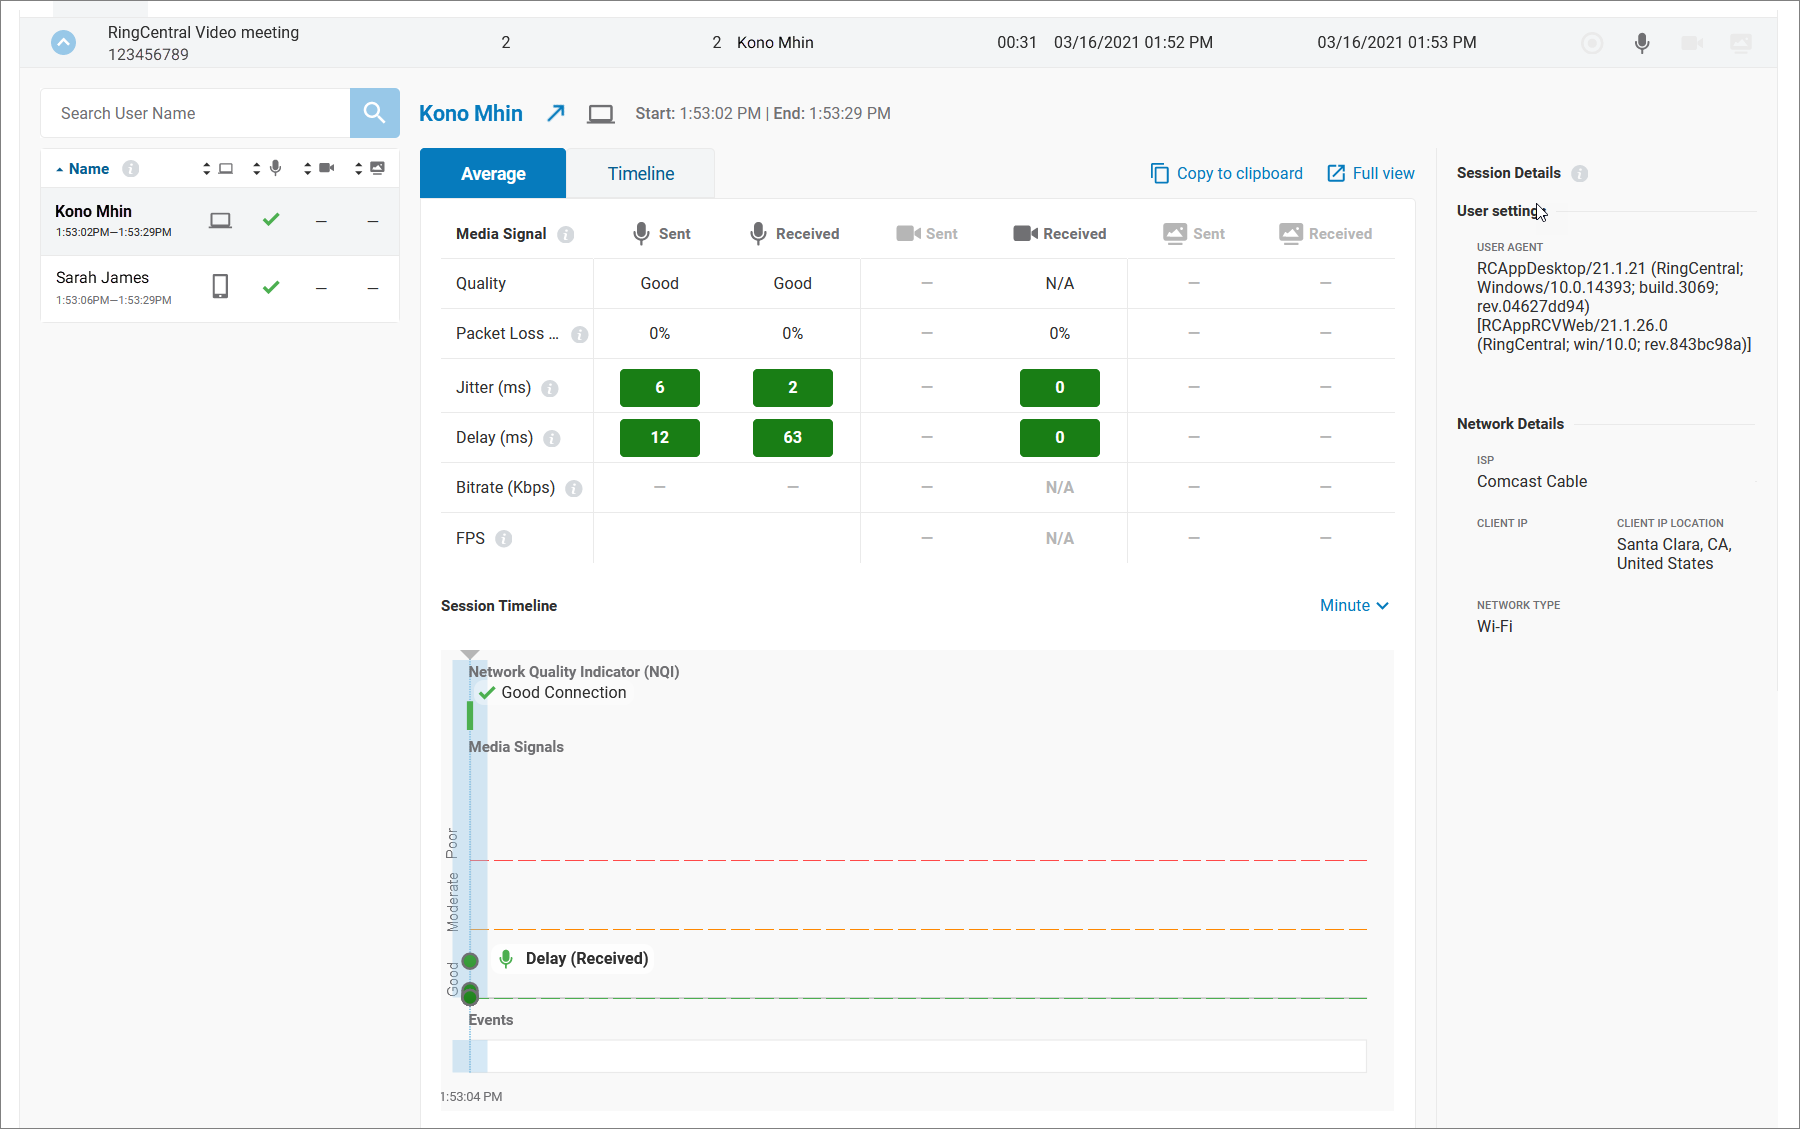
Let’s review each component of this screen separately.
Top line

The top line of the card shows:
- Search field: Use the search field to display the name of a meeting attendant. This is useful for finding one name in meetings with long attendee lists.
- Attendee name: Name of meeting attendees in first name alphabetical order.
- Arrow: Clicking on the arrow opens the user’s name in a new window in the QoS extensions tab.
- Endpoint: Shows an icon representing how the user connected to the meeting. Hovering over the icon shows its label.
- Start time: Time the user joined the meeting.
- End time: Time the user left the meeting. This can be helpful to see when a connection might have been severed before the meeting concluded.
Left panel

This panel lists:
- Name of each distinct dial-in
- Time they joined and left the meeting
- Applications used to connect, such as desktop app or mobile app, which is shown as an icon
- Quality of streams present in the session, shown as check marks under audio, video, and screen sharing
Clicking on any name shows a detailed call card for that participant’s connection in the main panel.
Main Panel
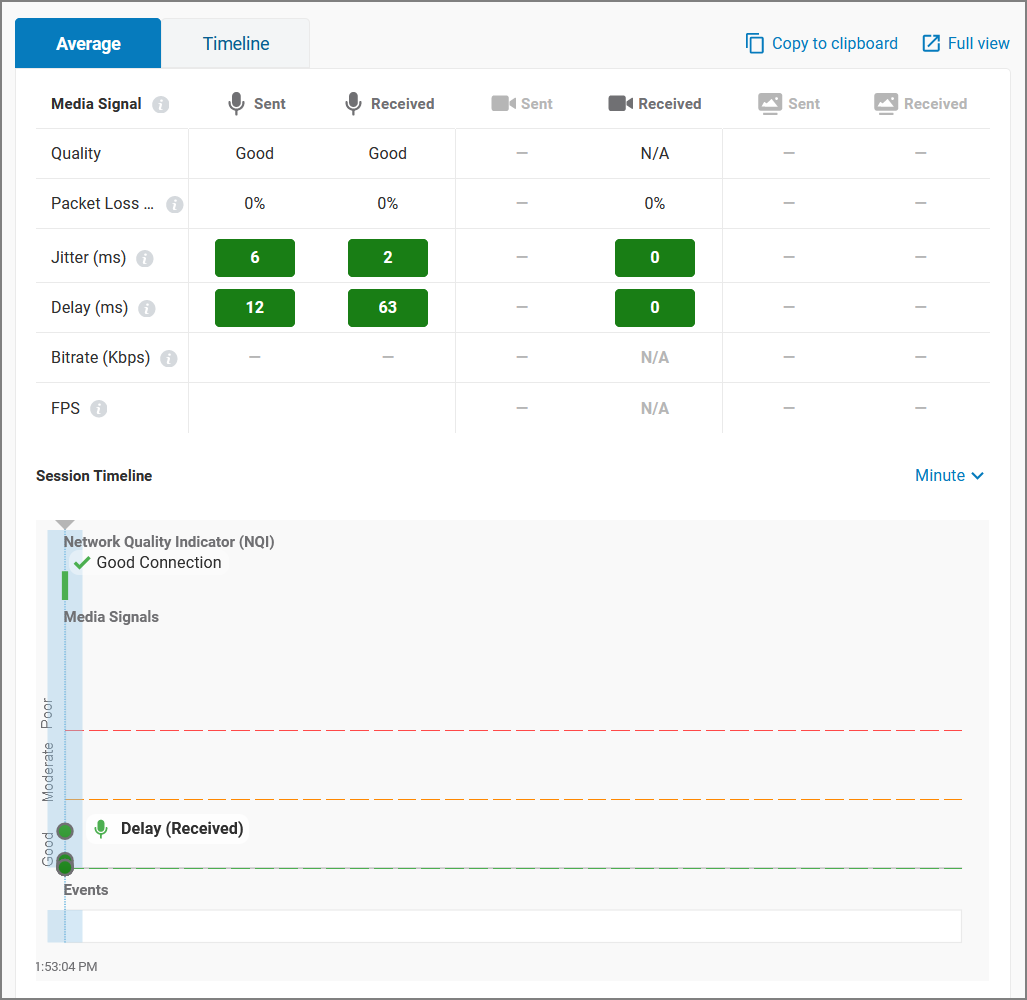
The top of the main panel shows:
- Average: Tab shows average details spanning connection.
- Timeline: Shows connection detail graph with option to toggle between displaying by minute or in ten second increments.
- Copy to Clipboard: Copies a text file of all details.
- Full view: Opens the current detail card in a new tab with an expanded view.
The Average tab shows the sent and received Media Signal performance for audio, video, and screen sharing for:
- Quality
- Packet Loss
- Jitter
- Delay
- Bitrate
- FPS
- Resolution
On entries where there is an information mark, clicking the icon expands to show more information.

Below the Average table, Session Timeline shows signal quality data over the duration of the meeting in graph form. Clicking in the graph toggles to the Timeline view. This view lets you examine data on a minute by minute basis. To see even more granular timeframes, click the down arrow next to Minute in the Session Timeline upper right to toggle to the 10 seconds view.
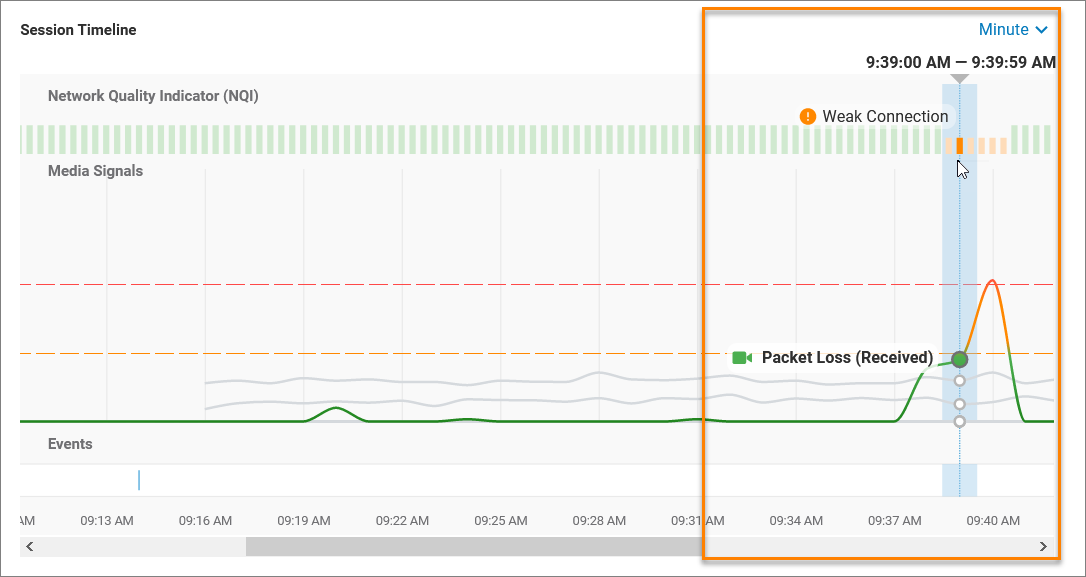
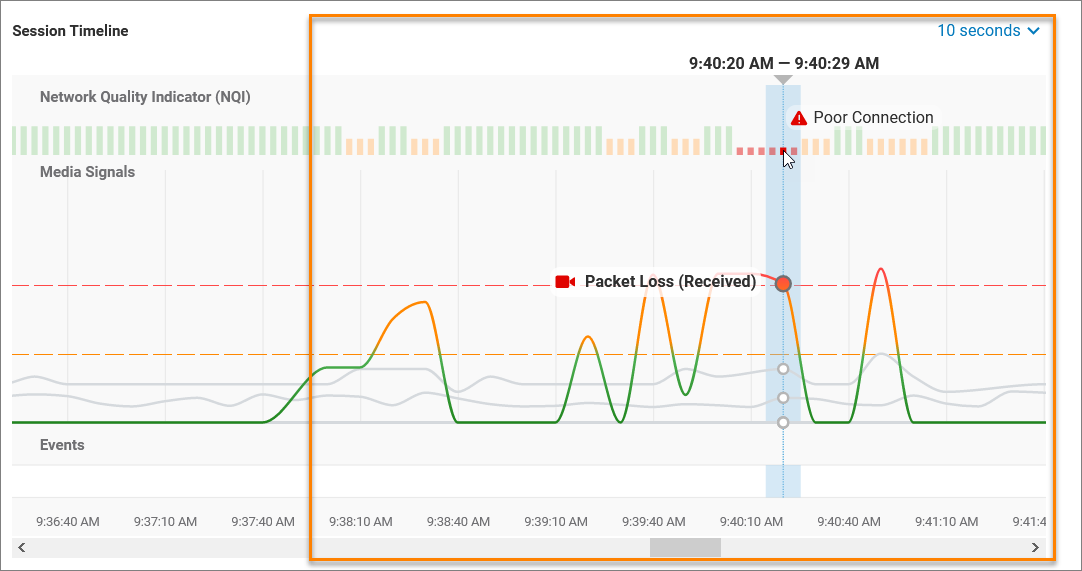
You can also see the timeline view by clicking the Timeline tab in the upper left of the call card.
This is useful for troubleshooting issues by following the precise time connection quality dropped. For example, if you’re an IT administrator who’s been asked why an employee experienced a poor connection, you could search on the employee’s name to find out all the meetings they’ve attended and zero in on the problematic meeting. Opening the call card shows a quality drop at 9:39. Switching to 10 seconds view shows the quality spiking and diminishing between 9:38 and 9:41. You could ask the employee if they were doing anything at that moment. You could find out that the dog was barking inside the house, so the employee went outside to hear better, but was then further from their internet connection, which affected quality. In that case, you could advise the employee that their connection outside is weaker than it is in the house.
Right panel

In the far right panel are the Session Details, which shows the user’s device and network data during the meeting session. These include:
- User settings
- User agent
- Codec
- Network Details
- ISP
- Client IP
- Client IP Location
- Network type
© 1999-2022 RingCentral, Inc. Todos los derechos reservados.