
Engage Digital | Volume reports
Volume reports are a standardized way to get information on the volume of messages in your contact center. There are a variety of volume reports that represent the most common data that you may want to analyze. You can find your volume reports by navigating to Analytics > Volume and selecting a specific report.
By default, each report shows all messages (incoming and outgoing messages). You can filter volume reports to view only incoming or outgoing message statistics by selecting Incoming Messages or Agent Messages from the dropdown menu.
Let’s review the different reports that you can use.
Messages by channel report
The Messages by channel report allows you to analyze the distribution of incoming and outgoing messages by channel. These measurements include incoming messages from customers, and the outgoing messages of a team, an agent, or a service provider.
Analyzing the distribution of incoming flows
To view the incoming flows, select Incoming Messages from the dropdown menu.
This view allows you to visualize the channels that your customers use the most over the selected period.

By filtering by category, you can then visualize the distribution of the types of requests and the subjects covered through your different channels (according to the categories you’ve created in the admin interface).
For example, the Grand Travel - Engage Messaging channel makes up 25% of the messages received for December 9, 2020.
Analyzing the outgoing flow of a team, an agent, or a service provider
By filtering by Agent Messages, then by team(s) or agent(s), you can check which channels these teams or agents respond to primarily. If you outsource part of your feed through a service provider and a corresponding team has been created, you can analyze their outgoing flow and compare it to yours.

For example, among the messages assigned to a team, messages on a Facebook channel represent 38% over a selected period. Also, suppose that the team has not processed messages on Android in-app chat (0%).
Messages by category report
The Messages by category report allows you to analyze the distribution of incoming and outgoing messages on the various sectors of activity, routing teams, or skills that have been created in the Admin section of the platform. The data in this report is not fixed and is bound to evolve over time. Indeed, a message can be recategorized after having been categorized for the first time.
To create this report you must select a parent category in the rightmost field. You can then filter by child category using the second field.
See the most mobilized skills by channel
One way you can use the Messages by category report is to see the most mobilized skills by channel. You can filter by subcategory to visualize the distribution of messages in this category according to the skills. For example, 29% of the messages in the Disposition category are billing inquiries.

Determine recurring causes of contact
If you have created disposition categories to categorize your incoming messages, you can select the corresponding parent category (the right-most field) to view the causes of contact. The disposition categories differ from the other categories in that the agent assigns them at the end of the conversation, when they have a better idea of the reason for the customer contact.
Messages by status report
The Messages by status report shows in absolute terms the number of messages per status that have been sent or received over the selected period. The data in this report is not fixed and is bound to evolve over time. Indeed, an agent message or an agent response always keeps the same status, while an incoming message changes status until it is replied or archived.
As a result, the number of agent messages / responses can only increase over time, while the number of incoming messages (new, processing, replied, or archived) is likely to increase or decrease over time.
This table shows the descriptions of each of the message statuses in the report.
| Status | Description |
| NEW | Initial state for new messages that have not yet been engaged
|
| IGNORED | Message that has been ignored after an agent clicked Ignore and does not require further attention |
| ASSIGNED | Message assigned to the current agent after they engaged with an interaction |
| AGENT REPLY | Reply from an agent after they clicked Reply or Private reply |
| REPLIED | Message that has been replied to by an agent after they clicked on Reply or Private reply |
| AGENT MESSAGE | First post in a discussion thread started by an agent |
Calculating the engagement rate (for social networks)
In the case of social networks, the engagement rate tends to represent the proportion of client messages handled more than the contact rate.
Where the rate of contact is the ratio of the number of threads to at least one conversation on the total number of threads, the engagement rate is the ratio of processed (responded and assigned) messages on all incoming messages (replied, archived, and assigned).
On chat, a discussion thread corresponds to a single client conversation. On social networks, however, a discussion thread often gives rise to several client conversations. Thus, on social networks, the scale of the discussion thread is no longer representative of the contact rate, and it is then necessary to rely on the scale of the message. You calculate the engagement rate that meets this need as follows:
Engagement rate = (assigned + replied) / (new + assigned + replied + ignored)
You can also calculate engagement rate using the following alternative formula. This formula shows a rate of commitment more favorable to the agents, as it reflects the rate of messages seen and activated by agents:
Engagement rate = (assigned + replied + ignored) / (new + assigned + replied + ignored)

For example, suppose that in the current period, you calculate that 84% of the messages received were answered. You performed this calculation by summing the New, Assigned, and Replied messages (3, 1, and 30 respectively), and dividing by the total number of incoming messages which total 76.
You calculate the engagement rate as (1+30)/(3+1+30+3) = 84%
Measure the number of messages processed and the number of messages ignored
Note the following considerations when interpreting results:
- A message with the Assigned status corresponds to an unanswered message in an open procedure, that is to say a message to which an agent will respond to (after having clicked Engage)
- A message with the Ignored status corresponds to a message that will not receive a response. A message may have been archived:
- Manually, by the action of an agent (they clicked on Archive).
- Automatically, by the action of the rules engine, AI engine, or channel configuration
For example, you might see among all the incoming messages:
- Assigned messages: 1 message has been added to the queue of tickets to be processed and have not received a response at the time of the consultation
- New messages: 3 messages have not received a reply at the time of the consultation and have to be examined to judge their relevance
- Ignored messages: 3 messages were examined manually by agents at the time of the consultation, but were considered irrelevant and / or not requiring a response
- Archived messages: 0 messages have been ignored automatically, according to the automatic archiving settings on the channel
Measure the volume of outbound campaigns
If you regularly post branded posts on social networks, you can follow the evolution of this volume in the Agent message row. Agent messages include all spontaneous outgoing messages that do not follow up on a customer request already initiated and logged in to the system.
On social networks, agent messages correspond to posts of the brand. On email channels, agent messages may include confirmation from chat conversations. For example, suppose that for the current month and for the Twitter channel, 27 brand tweets have been posted: this is 41.30% less than the previous month’s 46 tweets.

Messages per type of people report
The Messages per type of people report allows you to view the time evolution of incoming (Incoming messages) and outgoing (Agent messages) flows.
The more superimposed the curves, the more reactive the agents are to the variations in traffic. The difference between the curves corresponds to the volume of unanswered messages (New, Ignored or Assigned).
Measuring the number of client messages received and agent messages sent over a period
One way you can use the Messages per type of people report is to measure the number of client messages and agent messages that were sent over a period, and compare against the previous period to see the growth.
Let’s say you want to examine the number of client and agent messages over the period of a day. First, be sure you have chosen Day in the time period filter. You will then see a graph and table that present the number of client and agent messages for today (current period) and yesterday (previous period).
For example, 95 incoming messages were received from customers in the current period, and 153 messages were received in the previous period. The amount of incoming messages in the current period is 37.91% less than the amount in the previous period.

Identifying unusual traffic days and the proportion of responses
Typically, agents will respond in proportion to the number of messages received and there will be a similar number of incoming and received messages. However, suppose that there is a significant discrepancy between incoming and outgoing messages, with a greater volume of incoming messages than agent messages. You would want to identify the reason for this discrepancy, which could be, for example, because of a contest launched over this period.
Suppose that your company ran an outgoing campaign during which agents initiated the publication of new messages. During that time period, you could expect to see a greater amount of agent messages than incoming messages.

Messages per privacy report
The Messages per privacy report shows the number of private and public messages over the previous period, the number of messages over the current period, and the progress between those two periods. This report is only relevant for social channels, where private and public messages can be sent. Private messages are those sent directly through a direct message, while public messages are those that appear on public feeds. If channels of another type are connected, filtering by channel is necessary.

When you see a majority of private messages on channels, that means customers are preferring private exchanges.
Messages per type of contributions report
The Messages per type of contributions report shows the actual number of messages broken down by the specific type of message that came from one of the channels that you have configured in the system. A contribution type is a method that a channel uses to send a message such as a private message, a comment, or a video.
Each channel has its own specific contribution types. This report allows you to understand the specific techniques being used by your customers to reach out to your business using your channels.
You can click items in the graph legend to hide or redisplay a contribution type.

Messages per author report
The Messages per author report gives the absolute number of new responders, the number of unique responders per day, and the number of new messages. These metrics are defined as follows:
- New contact: Someone who prompts the creation of a new conversation for the first time
- Unique contact per day: One-time contributors per day is calculated as follows: if a person contacts the brand several times during a day, there is one single participant on the day. If the selected period is one week and the person contacts the brand five days in a row, we count 5
- New message: Corresponds to incoming messages
Note: If you have merged the identities of a person, we will count 1 by identity: 1 identity = 1 single responder
Viewing the rate of repeat contributors
Using this report, you can analyze whether your channels have new or repeating contributors. For example, if you have a high rate of new contributors, this means your channel does recruitment. In other words, these are new people contacting your brand. On the contrary, if the rate of new contributors is low, these are the same people who will contact you regularly.
On social networks you typically seek to recruit a high volume of new contributors. For a community forum, on the other hand, mutual assistance is important and it is not a problem if this channel has regular contributors.
For example, when a channel shows a rising volume of new contributors, this shows that it is recruiting.

Messages by hour report
The Messages by hour report shows you the absolute number of messages per hour over the selected period. The report shows, per hour, the average number of messages, the total number of messages and the percentage of the total number over the selected period.
If a day is selected, the average will be equal to the total. If a period greater than one day is selected, the average is calculated per hour time slot and then the total.
Workforce management based on the flow of incoming messages
You can use the Messages per hour report to manage your workforce based on incoming message flows. To do this, you select Incoming in the messages from the messages filter.
This report can be used together with the Messages by day report to see both daily and hourly data.
For example, suppose that your incoming message flow is greatest between the hours of 11am and 12pm. You would want to use more agents when you see your highest incoming message flow.

Messages by day report
The Messages by day report shows you the absolute number of messages per day over the selected period. The detail shows the average number of messages per day, the total number of messages per day and the percentage of the total number over the selected period.
If a week is selected, the average will be equal to the total. If a period greater than one week is selected, the average is calculated per slot and then the total.
Workforce management based on the flow of incoming messages
You can use the Messages by day report to manage your workforce based on incoming message flows. To do this, you simply add the Incoming Messages filter.
This report can be paired with the Messages by hour report to see both daily and hourly data.
For example, suppose that your incoming message flow is more significant on Wednesdays and Thursdays. In this case, you would want to use more agents to handle customers on those days.

Messages by language report
The Messages by language report gives the volume of messages per language activated over the selected period. This part only appears if you have a multilingual console or uses automatic language detection.
Workforce management based on the flow of language skills
Using this report, you can determine the language skills you need to process the message volume. For example, your report might show that 98% of the messages are written in English, 2% in Spanish and 1% in French. The data in this report will allow you to allocate the correct numbers of agents with those language skills to handle incoming messages.

Interactions by hour report
The Interactions by hour report shows you the average number of created digital interactions per hour over the selected period. You can use this report to manage your team sizing and forecast of incoming with an interactions.
The report shows the average number of with an interactions, the total number of interactions and the percentage of the total number over the selected period. If a day is selected as a period, the average will be equal to the total. If the period is greater than one day, the average is calculated per slot and then the total.
For example, you select to show the interactions from 12am to 11pm. You see that the average number of interactions for most of the day is fewer than 3 interactions per hour. You also see a peak of about 2 interactions per hour from 2:00am to 2:59am and another peak of nearly 3 interactions per hour from 11:00am to 11:59am.
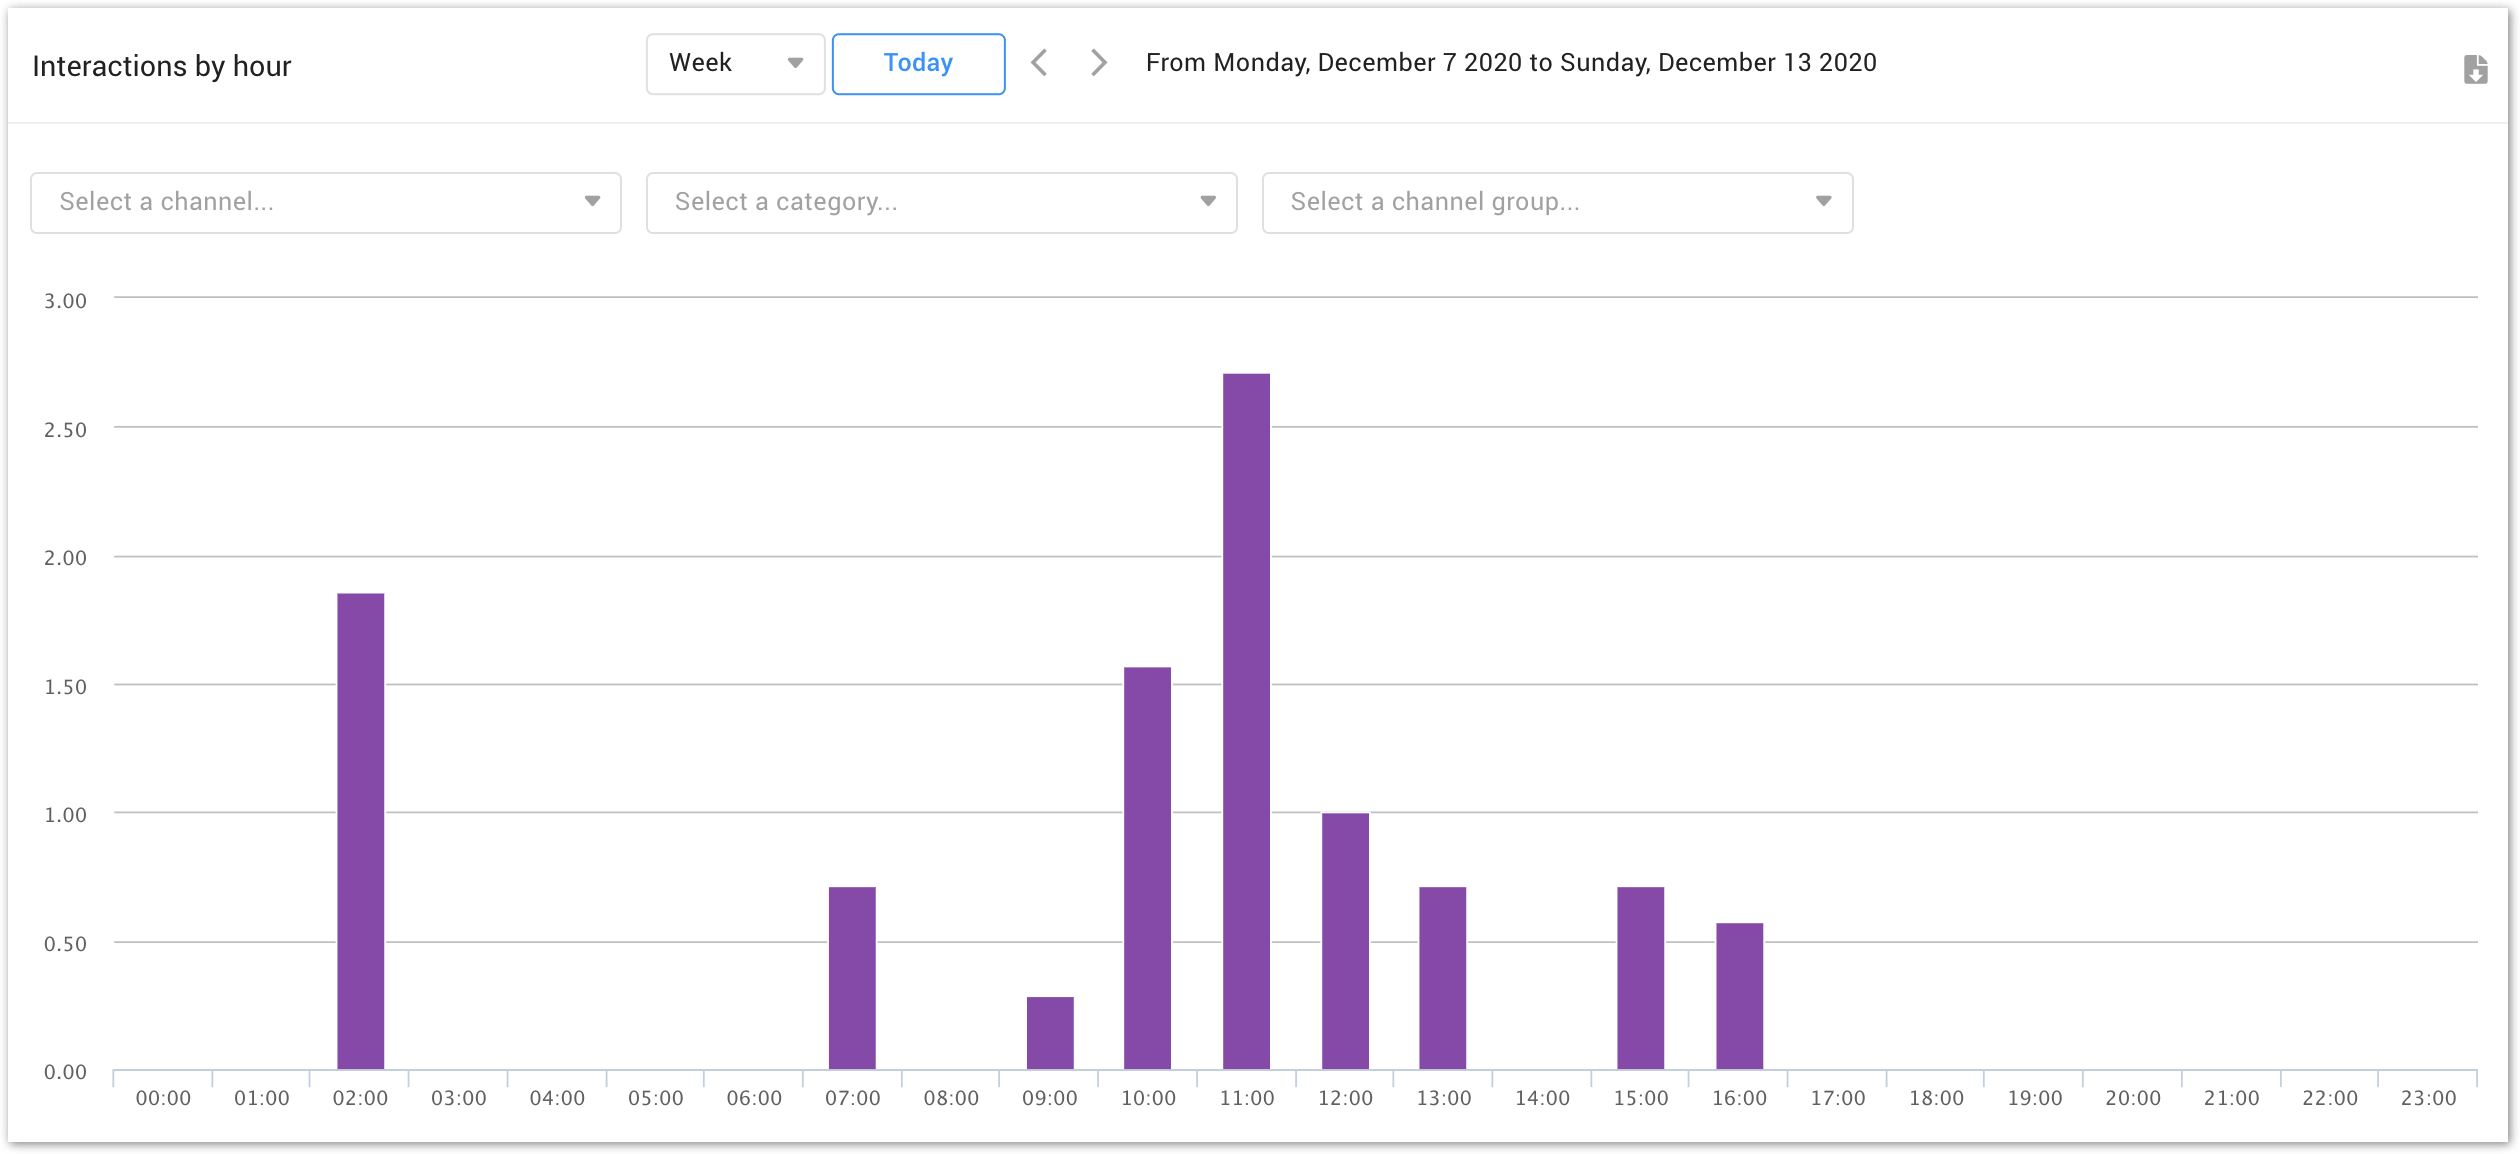
If an interaction has been transferred from one agent to another, it will be counted only once. The same behavior occurs for deferred interactions – an interaction that has been created after the deferred period is not taken into account.
Interactions transferred by hour report
The Interactions transferred by hour report shows you the average number of transferred digital interactions per hour over the selected period. The table shows the average and total numbers of transferred interactions per agent per channel.
If a day is selected as a period, the average will be equal to the total. If the period is greater than one day, the average is calculated per slot and then the total.
For example, you select to show the transferred interactions for the time period 11am to 6pm. You see that the hours with the highest average number of transferred interactions are 2pm and 6pm where an average of one interactions per hour is transferred.

The logic of this report is the following:
- When an interaction is transferred several times, each transfer is counted separately;
- Non-routable and disposition categories are excluded from the report;
- Force assignment is not taken into account for this report too.
Interpreting results: evaluating the impact of transferred interactions
Note the following considerations when interpreting results:
- Transferred interactions must also be considered along with created interactions (see the Interactions by hour report) for forecasting and team sizing because transfers must be taken into account as incoming flows
- Transferring interactions from one skill to another can impact productivity and helps evaluate agent behavior
Conversations by category report
The Conversations by category report shows you, in absolute value, the number of conversations (open or closed at the time of the consultation) created by a category over the selected period. The detail shows the number of conversations over the previous period, the number of conversations over the current period and the growth between these two periods.
Unlike the Messages by category report, this report is based on the conversations and allows you to see how many conversations have been treated according to the category of message.
If you have created disposition categories, you can select the corresponding parent category (rightmost field) to view the refined contact reasons. Disposition categories differ from the other categories in that the agent assigns them at the end of the conversation, when they have a better idea of the reason for contact.
Ensuring that agents respond to requests with the main contact reasons
For example, suppose that during a selected period you see that your agents opened 14 conversations (by clicking Engage). These conversations may still be open or closed. Say that you can see that the main contact reason is categorized as Cancellation.

Chat thread by trigger report
The Chat thread by trigger report shows the triggers that were triggered chat sessions over the selected period. A chat trigger results in creating a new chat session, and a trigger is applied always on your website, or based on a condition occurring that you define.
Triggers with a low trigger number are grouped under Other. The detailed breakdown for Others is available under the graph. This report is available only if you have connected at least one Engage Chat channel.
Tracking chat activity and modulating triggers
You can use this report to see which triggers are the most/less effective. The triggers with highest numbers tell you which pages lead to most chat sessions or which pages may be more problematic for customers.
If a trigger triggers only a few chat sessions, the page may not pose a problem for customers, the trigger may not be configured ideally, or it may not be visible enough.

Messaging thread by trigger report
The Messaging thread by trigger report shows the triggers that were triggered chat sessions over the selected period. A messaging trigger results in creating a new messaging session, and a trigger is applied always on your website, or based on a condition occurring that you define.
Triggers with a low trigger number are grouped under Other. The detailed breakdown for Others is available under the graph. This report is available only if you have connected at least one Engage Messaging channel.
Tracking messaging activity and modulating triggers
You can use this report to see which triggers are the most/less effective. The triggers with highest numbers tell you which pages lead to most messaging sessions or which pages may be more problematic for customers.
If a trigger triggers only a few messaging sessions, the page may not pose a problem for customers, the trigger may not be configured ideally, or it may not be visible enough.
Threads by channel report
The Threads by channel report shows you the number of threads by channel over the selected period. This report is based on the day the thread was created.
Assessing the number of threads created on Chat, Engage Messaging, or Facebook Messenger
This report is especially useful for Engage Messaging or Facebook Messenger channels because on those channels, one thread generally corresponds to one inquiry. To allow this data to be as accurate as possible, agents should remember to close a thread when a conversation is over on Engage Messaging or Facebook Messenger.
The ‘Messages by …’ reports are not really suitable for these channels because the interest is on the number of open discussion threads rather than on the number of messages sent / received.
For example, suppose that in the current period 15 discussion threads were created on Engage Messaging (Tellme Mobile Android) and 72 on Engage Chat. Those numbers represent the number of contacts respectively for the channels.

For example, with the previous numbers the distribution of the threads by channel would show that 30% of the threads were created on Email, and 14% of the threads were created on MMS.

© 1999-2022 RingCentral, Inc. Todos los derechos reservados.